In today’s era of digital transformation, data is one of the quintessential tools for scaling your online business. Collecting and analyzing customer data can be tricky, especially when doing it for the first time.
Despite its importance, most small and medium-sized businesses avoid analytics because they have limited ideas on collecting and using customer data.
In this article, we will focus on guiding you through the process of collecting and using customer data. We will also be guiding you through the entire eCommerce analytics process.
So what exactly is eCommerce analytics, how can you collect and analyze relevant data, and why is it so important from a business perspective? Let’s get into it.
What is Ecommerce Analytics?
Before jumping into eCommerce analytics, let’s discuss an inseparable element associated with it: customer data.
Any information a consumer offers while interacting with your brand through online or physical channels is typically referred to as customer data. All major brands recognize the value of consumer data and develop data-driven strategies to learn from their target market. The type of data you collect is what defines your eCommerce analytics strategy.
Ecommerce website analysis helps you determine what is and is not working for your business. It involves collecting, analyzing, and interpreting data from eCommerce websites and online stores.
This data can include information on customer behavior, such as the pages they visit and the products they purchase, as well as data on sales and revenue.
Why Do You Need Ecommerce Analytics?
It’s safe to say that the ecommerce sector is massively competitive. With the emergence of new tools and innovative marketing strategies, companies have to constantly keep up with their competitors to survive in this competitive space. Any wrong move can be fatal. This is where eCommerce analytics comes in.
The ultimate goal of analytics is to help store owners make sound strategic decisions that will scale their businesses.
Ecommerce website analysis plays a vital role in scaling up any business. It aids in formulating & realigning Product strategies to reach business goals faster and more efficiently. Analyzing customer data helps store owners predict future trends using reports based on various variables.
Such analysis helps predict future sales and enables retailers to decide which products to concentrate on, whether to alter inventory, what marketing strategies to employ to promote particular products, and what promotions to provide on various products.
It is also a great way to monitor and manage your inventory. By predicting future trends and analyzing the current sales performance of various products, you can determine which products to hold in your inventory and which products need to be cleared.
What Customer Data Do You Need?
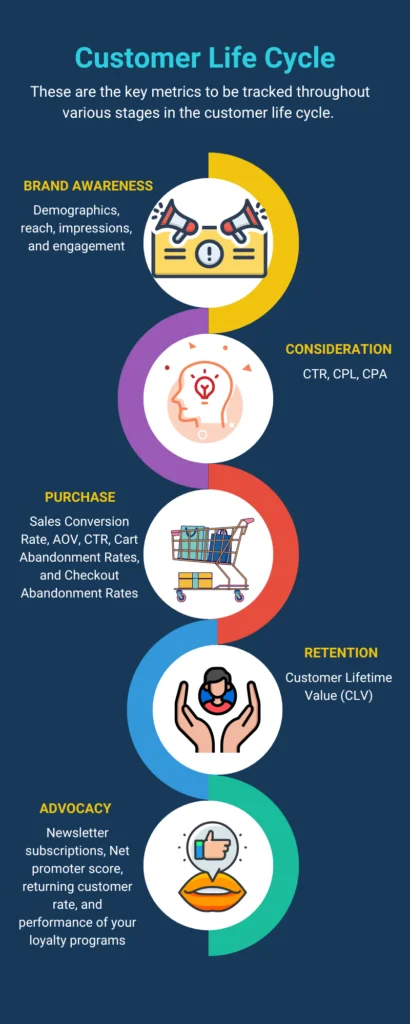
Retailers often think they have to track and analyze hundreds of metrics from different sources manually. Fortunately, that isn’t the case. Retailers should only collect and track data that is relevant to their business. Before tracking any metrics, we need to understand the various stages in the customer lifecycle.
This is a crucial step, as the metrics you monitor are deeply connected with the different stages of the customer lifecycle.

1. Brand Awareness
The brand awareness/discovery phase in the CLC focuses on reaching out to your potential customers. In this stage, you have to track demographic data related to your customers. You can track key metrics like age, gender, geographic location, interests, and behavior.
All the data related to demographics can be accessed under the “Audience” section on the left panel of your Google Analytics dashboard.
Social media and email marketing campaigns are among the best ways to increase your overall reach. Metrics such as reach, impressions, and engagement provide a lot of insight into how your social media campaigns are performing. Apart from these metrics, you can also monitor social media and email campaigns.
The data collected from the awareness stage is extremely valuable for understanding your target audience. This data can be used to create user personas, with the help of which you can center your product and marketing strategies.
2. Consideration
The customer enters the consideration phase when they land on your website. This is a delicate stage, as this is the first time they interact with your website. You can track metrics like organic search clicks, click-through rates (CTR), cost per lead(CPL), and cost per acquisition (CPA). These metrics can be easily accessed from your website’s Google Analytics dashboard.
Click Through Rate (CTR)
CTR is the number of clicks your link (ad, social media post, email) receives, divided by the total number of users who viewed the content.
For example, if you have eight clicks and your ad/content has 100 impressions, your CTR is 8%.
CTR gives you insight into your clients and reveals what approach to take to reach your target market. A low CTR indicates that you’re aiming for the wrong demographic or that you need to persuade them to click through with your use of their language.
Cost Per Lead (CPL)
CPL is the amount of money spent on getting a new lead for your sales team. This might not be relevant in a typical store, but if your business operates by converting leads, then this is a must-track metric.
If your CPL exceeds industry standards (compared to competitors), your marketing campaigns aren’t efficient.
Cost Per Acquisition (CPA)
CPA is a better metric to track if you are a retailer who doesn’t depend on leads. DTC brands prefer CPA as it is directly related to purchasing a product. CPA is the cost of a prospect buying a product. A lower CPA indicates that your marketing campaigns are efficient.
3. Purchase
The purchase stage is when a prospect is delighted with your product and becomes a customer. The purchase/conversion stage is the most critical stage in the CLC, as it directly brings revenue to your brand.
Sales Conversion Rate, Average Order Value, CTR, Cart Abandonment Rates, and Checkout Abandonment Rates are some of the most important metrics to track during this stage. Let’s learn more about these metrics and understand their importance.
Sales Conversion Rate
It is the total number of sales (conversions) divided by the total number of visitors. Sales conversion rate is a valuable metric to determine the performance of your marketing efforts and product performance.
Average Order Value
Average Order Value (AOV) is the average amount of money a customer spends on a single order. It is calculated by dividing the total revenue by the number of purchases (orders). By providing you with the measurements required to gauge the long-term value of individual clients, knowing your company’s average order value aids in evaluating your overall online marketing initiatives and pricing strategy.
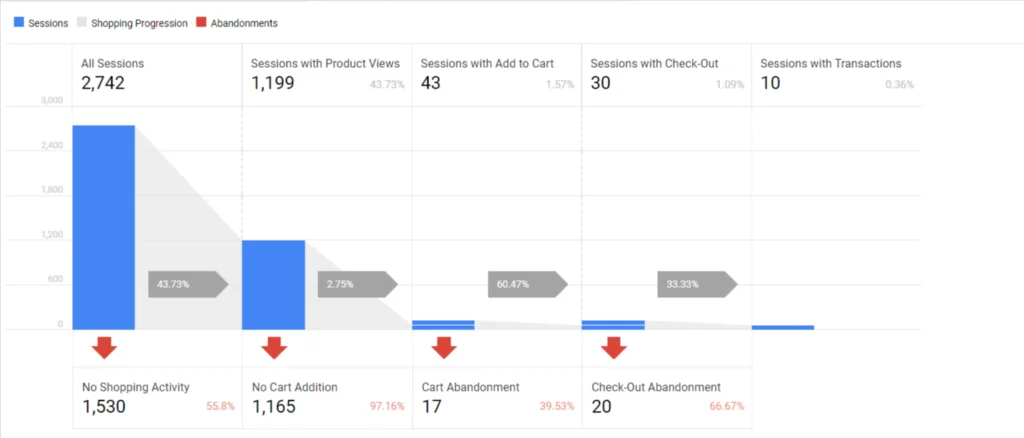
Cart Abandonment Rates
It is the percentage of people who add products to the cart but don’t complete the purchase. A high cart abandonment rate is a severe issue for retailers as cart abandonment and conversions are inversely related. Conversion is one of the most important metrics related to eCommerce.

Reducing cart abandonment helps you improve the conversion rates of your store. The higher your conversions, the better your store’s performance.
Checkout Abandonment
It is another metric you should consider while monitoring conversions. The checkout abandonment rate is the percentage of users who exit during the checkout process.
Checkout page optimization is the key to reducing checkout abandonment rates. Read our article on checkout page optimization to understand how to perfectly optimize your checkout page to reduce your store’s cart abandonment and checkout abandonment rates.
All the data associated with conversions can be found under the Conversions section on the left panel of your Google Analytics dashboard.
4. Retention
Retaining loyal customers is the goal of every retailer; it is the phase that sustains a business. Most eCommerce stores reward their loyal customers with discounts and bonuses to retain them. According to research, retaining 5% of existing customers can increase profits by up to 25%-95%. This range is quite broad because it takes data from various sectors into account.
In this phase, you should prioritize tracking Customer Lifetime Value (CLV). CLV is the total amount of money a customer is expected to spend on your products in their lifetime. Increasing CLV is the primary focus of almost every business, and it is considered to be one of the most important metrics for tracking the performance of a business.
CLV is a metric that is dynamic and is calculated based on various predictions. The formula for calculating CLV is as follows:
CLV = Customer Value x Average Customer Lifespan
There are multiple approaches to determining CLV. You can read more about different CLV approaches to find the most accurate way for your industry.
5. Advocacy
Customers entering this stage are true fans of your offerings. These customers act as brand ambassadors for your products, talking about them to their friends and family. It’s a great way to promote your brand. After all, who doesn’t love a free promotion?
But sadly, this stage is often overlooked by many retailers. Concentrating on the right metrics during this stage of the customer lifecycle can differentiate a great business from an average or a good one.
Newsletter subscriptions, Net promoter score, returning customer rate, and performance of your loyalty programs are critical metrics to track during this stage.
Net Promoter Score (NPS)
The net promoter score (NPS) is a market research metric to measure customer loyalty and satisfaction. It is calculated by asking customers how likely they are to recommend a company’s product or service to a friend or colleague on a scale from 0 to 10, with 0 being not at all likely and 10 being extremely likely.
Customers who respond with a score of 9 or 10 are considered “promoters,” while those who respond with a score of 0 to 6 are considered “detractors.” The difference between the percentages of promoters and detractors gives the NPS.
A high NPS indicates that a company has a large number of satisfied and loyal customers who are likely to promote the company’s products or services to others. A low NPS, on the other hand, indicates that the company may need to improve its products or services to better meet the needs of its customers.
Understanding what metrics are best for you is an important step while initiating your analytics journey. But where do you get the data from? You can get the data from various analytics tools that fetch customer data from your website and your marketing campaigns. So, what are some of the tools you can use to measure the performance of your store?
Top eCommerce Analytics Tools
Analytics tools are abundant in the market. The tricky part is to find the ones that fit your business needs. Below, we have mentioned five essential analytical tools for any business.
1. Google Analytics
Google Analytics is a web analytics service offered by Google that tracks and reports website traffic. It is the most widely used web analytics service on the internet.
With Google Analytics, you can track and analyze information about the demographics of your website visitors, what devices and browsers they use, how they found your site, which pages they visit, and how long they stay on your site. Analyzing these reports can help you improve your website’s performance and marketing efforts.
2. Hotjar
Hotjar is a website analytics and user feedback tool that allows you to see how users are interacting with your website. It provides a range of features, including heatmaps that show where users are clicking on your site, recordings of user sessions, and polls and surveys that you can use to collect feedback from your visitors.
With Hotjar, you can get a better understanding of how users are using your site, identify areas for improvement, and optimize your website to better meet the needs of your visitors. Hotjar plays a key role in helping retailers improve conversions on their websites and find unwanted gaps in website UX.
3. Google Search Console
Google Search Console is a tool that helps website owners monitor and maintain their website’s indexing in Google Search results. With Search Console, you can see how Google crawls and indexes your site, get alerts when there are issues with your site, and see which queries are driving traffic to your site.
This information can be invaluable for identifying and fixing technical issues on your site, improving your search engine optimization, and making sure that your content is being discovered by the right people. Search Console is an essential tool for anyone looking to improve their site’s performance in Google search.
4. Social Media Analytics
Social media analytics is vital in evaluating and enhancing a company’s marketing efforts. With social media analytics, businesses and organizations can track and understand the impact of their social media campaigns and initiatives, identify trends and patterns in user behavior, and make data-driven decisions to improve their social media strategy.
Some popular tools for social media analytics include Hootsuite, Sprout Social, and Meta Business Suite. These tools can provide insights into key metrics such as engagement, reach, and conversion, allowing businesses to optimize their social media efforts and drive better results.
5. E-mail Analytics
E-mail marketing is a great way to widen your reach. Now more than ever, it’s critical to monitor the information your consumers are interacting with and to deliver them tailored content depending on that interaction.
E-mail tools like Mailchimp and Sendgrid have an analytics option to monitor opens, clicks, subscribers, and other metrics.
This can be accomplished by linking your email tool with your eCommerce platform and providing as much content to the email-sending tool as possible.
Now that you have learned about the metrics and tools used for collecting and analyzing customer data, let’s understand how to execute the entire eCommerce data analytics process.
How to Set Up Analytics for Your Store: A Step-by-step Guide
Identify and Track the Right Metrics
Determine which data points are needed and list down the data sources before attempting to merge all of your data in one location. The easiest approach to achieve this for an eCommerce business is to analyze your client journey and pinpoint the critical data elements at each stage.
There are generic metrics that are relevant to almost every business; meanwhile, there also are industry-specific metrics. Identifying the metrics relevant to your industry is the most important step in the analytics process.
We have discussed earlier in this article all the critical metrics in various stages of the customer life cycle. These metrics are relevant for all industries and should be prioritized by online retailers.
Establish Your Desired KPIs
Key Performance Indicators (KPIs) are the metrics used to measure and evaluate the performance of a business or organization against specific goals and objectives. These metrics provide insight into whether a business is meeting its targets and how it compares to its competitors. KPIs can be financial or non-financial, and they can be used at the organizational, departmental, or individual levels.
KPIs can be as simple or complex as you like, depending on your individual business and what you want to accomplish. While some online retailers place a greater emphasis on client acquisition, others care more about repeat business and customer loyalty. Meanwhile, others are more concerned with revenue and profit or effective inventory management.
You can create a dashboard that lets you stay on top of any significant changes in your eCommerce business without becoming lost in a sea of data by concentrating on KPIs relevant to your business.
Clean and Organize Your Data
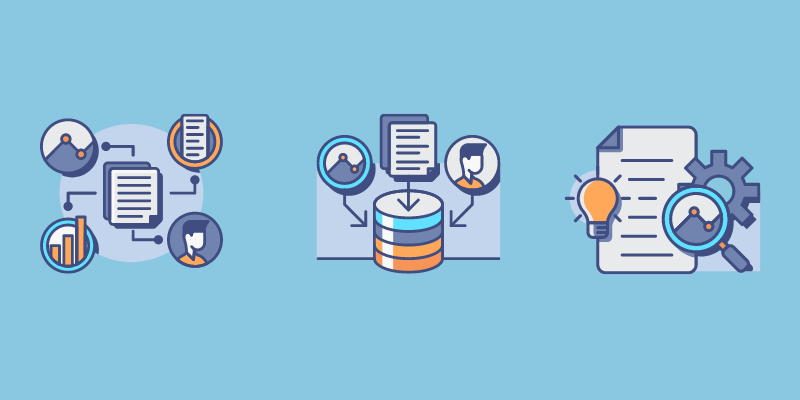
The data available from various sources is cluttered and unorganized. Therefore, before you can analyze this data, it must be combined, de-formatted, and then labeled so that various data points from various data sources may be compared to one another.
Marketers frequently deal with correcting various errors, adding missing details, or ensuring that duplicate items have been removed when cleaning data. The data organization process starts with gathering all the data in a single place.

Analytics platforms employ a transformation engine that unites data from several sources, removes the formats, and enhances the data with extra details and rules to facilitate analysis.
Most analytics tools allow users to export data. This enables marketers to align scattered data points more efficiently. The next step is to merge all the data into a single cohesive dataset for easier analysis and visualization.
Reporting
After organizing your data, you must create smart reports to compare different metrics. Creating reports makes it easier for eCommerce marketers to show the effectiveness of marketing initiatives. It gives insights to help businesses scale up their operations on time. A well-structured report makes it easier for business intelligence teams to perform data visualization.
Data Visualization
Data visualization is the graphical representation of data in a pictorial or graphical format. It helps to present complex data in an easy-to-understand way by using visual elements such as charts, maps, and graphs. By visualizing data, it is easier to identify patterns, trends, and correlations that might not be obvious from looking at raw data.

By creating visual representations of data, such as charts, graphs, and maps, data visualization allows people to quickly see patterns and trends in the data, identify outliers and anomalies, and gain insights that might not be apparent from looking at the raw data.
Data Visualization can be particularly useful for decision-makers, who can use data visualization to inform their decision-making and develop more effective strategies. Data visualization also helps to communicate data-driven findings to others, such as stakeholders, customers, and the general public.
Analytics tools often have data visualization abilities built into them. However, if you want to visualize data from different sources or create graphs for complex data sets, you can use tools like Excel, Power BI, or Tableau.
Conclusion
To summarize, eCommerce analytics can help retailers gain insight into customer behavior and preferences, optimize their marketing strategies, and improve the overall customer experience.
By leveraging data-driven analytics, eCommerce businesses can gain insight into the performance of their website, identify areas of improvement, and increase conversions. Using eCommerce analytics can provide a great advantage to eCommerce businesses to maximize customer satisfaction and profitability.
In the vastly competitive eCommerce space, analytics provides a huge competitive advantage to brands that use it correctly. In this article, we covered all the necessary steps to help you understand the entire eCommerce analytics process.
If you liked reading this, you should consider going through our other best articles:
- Top 10 Manufacturing Trends to Watch Out for 2025.
- Understanding the Key Components of a B2B Ecommerce Platform.
- How Can Implementation Positively Affect Your Online Store Experience
Start leveraging eCommerce data analytics today to uncover hidden growth opportunities & boost your store’s performance.


