Your best customer hasn’t ordered in 47 days. Will they churn? By implementing B2B AI customer prediction, you can know the answer 60 days before your sales team does. In wholesale distribution, customer acquisition costs 5-7x more than retention. Using your data to spot churn early is the most practical way to protect your revenue, improve retention, and sell more.
Most B2B sales teams flag customers who haven’t ordered in X days. They scramble when quarterly revenue looks light. They run blanket win-back campaigns. By the time you notice the signal (no order in 90 days, support tickets piling up, pricing complaints), the customer has already mentally churned.
B2B AI customer prediction models work differently than manual reporting. They spot early warning signals 60-90 days before your competitors do, flagging things like order frequency decay, basket size shrinkage, and category abandonment.
Consider this representative scenario. An industrial distributor’s sales team flagged at-risk accounts at 90 days with no order. Their predictive model flagged the same accounts at day 35-40. The model caught micro-signals: smaller orders, longer gaps between purchases, fewer SKUs ordered. Early intervention saved 28% of flagged accounts. The old 90-day rule? Just 11%.
3 Ways B2B AI Customer Prediction Helps You Sell More
Prediction becomes valuable when it changes what your sales teams do tomorrow. Three use cases deliver measurable impact.
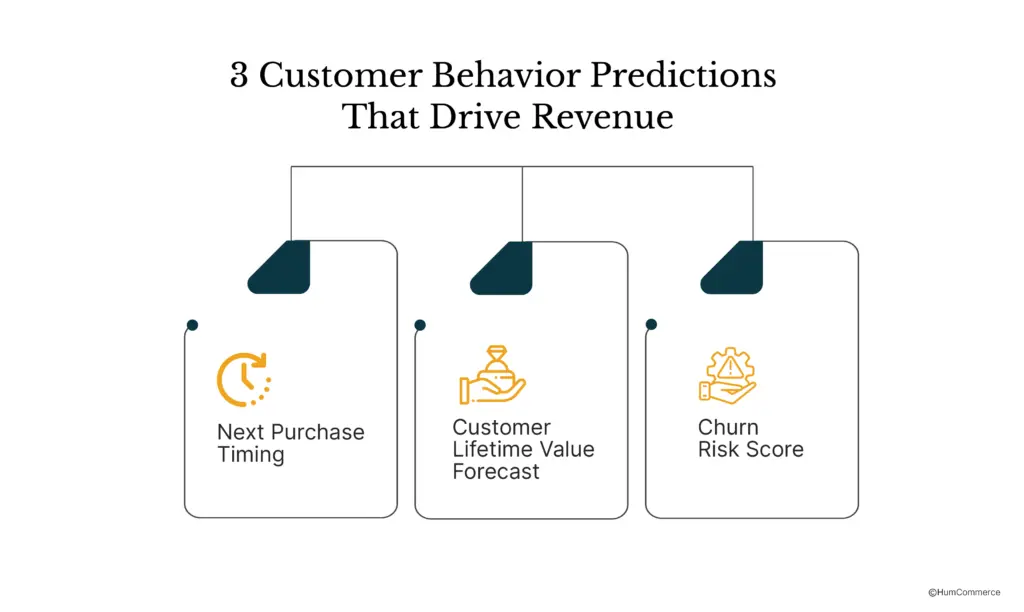
Next Purchase Timing predicts when an account will order again. Accuracy: ±7-14 days. Sales can time their outreach perfectly. Operations can prepare inventory.
Customer Lifetime Value Forecast estimates what each account will spend over 12-24 months. Accuracy: ±10-15%. You can segment accounts properly. You can allocate resources where they matter.
Churn Risk Score calculates the probability of 180+ day inactivity within 90 days. Accuracy: 70-85%. You can trigger retention campaigns before losing the relationship.
Here’s a representative scenario based on industry benchmarks. An HVAC parts distributor deployed all three models and tracked results over 18 months. Their outreach conversion jumped 34% when sales teams used next-purchase timing predictions.
Why? Because they stopped calling customers who weren’t ready and started calling exactly when buying windows opened. The LTV forecast revealed something unexpected: 22% of their sales capacity was focused on the wrong accounts. Without B2B AI customer prediction, sales reps are forced to guess which accounts need immediate attention.
They reallocated resources to high-value accounts. The churn model delivered the biggest impact. It identified at-risk accounts 60+ days before the sales team would have noticed anything wrong.
That early warning saved $2.1M in annual revenue that would have walked out the door.
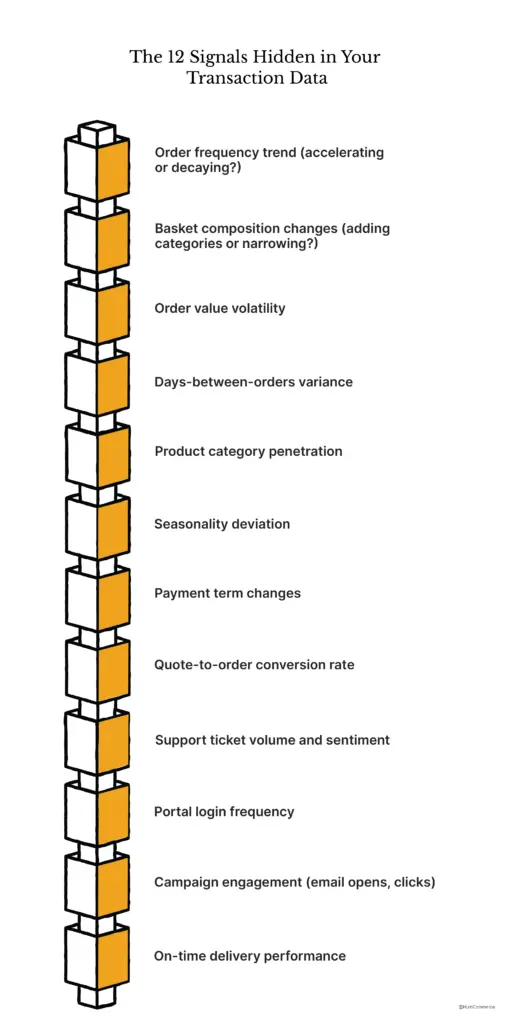
The 12 Signals Hidden in Your Transaction Data
Predictive models extract behavioral features from order history. They look beyond last order date. Most B2B companies already log 8-10 of these signals:
- Order frequency trend (accelerating or decaying?)
- Basket composition changes (adding categories or narrowing?)
- Order value volatility
- Days-between-orders variance
- Product category penetration
- Seasonality deviation
- Payment term changes
- Quote-to-order conversion rate
- Support ticket volume and sentiment
- Portal login frequency
- Campaign engagement (email opens, clicks)
- On-time delivery performance
Look at basket composition first. Are customers exploring new product categories? Or are they buying from fewer categories than before? This shift matters more than total spend sometimes.
Order value volatility is another tell. Some accounts swing between $5K and $50K orders with no pattern. Others stay remarkably consistent. The volatile ones behave differently when they’re about to churn.
Days-between-orders variance works similarly. If an account that normally orders every 23 days suddenly stretches to 31 days, then 38 days, something changed. The variance pattern predicts better than the absolute number.
How many of your product categories does each customer buy from? That’s category penetration. An account buying from 8 categories who drops to 3 categories is consolidating spend elsewhere. You’re losing wallet share before you lose the account.
Seasonality deviation catches the accounts that break their normal patterns. A contractor who always spikes in March and September but goes quiet in March? That’s a flag worth investigating.
Payment term changes fly under the radar at most companies. But when a reliable NET-30 customer starts asking for NET-60 or NET-90, financial stress is showing up. That predicts churn months before orders stop.
Quote-to-order conversion rate tells you about intent. Customers who used to convert 60% of quotes but now convert 20% are shopping you against competitors. You’re in danger of becoming the backup option.
Support ticket volume and sentiment can predict churn before any buying behavior changes. A spike in frustrated tickets, even if resolved, damages the relationship. The sentiment analysis catches what ticket count alone misses.
Portal login frequency seems minor but it’s not. Customers who stop logging into your portal have mentally checked out. They’re not browsing. They’re not exploring. They’re just fulfilling existing needs until they switch.
Campaign engagement (opens, clicks) shows who’s paying attention. An account that opened every email for 18 months who suddenly stops? They’ve tuned you out. Your messages aren’t landing anymore.
On-time delivery performance predicts churn better than most sales teams expect. Late deliveries stack up. Customers rarely complain about the first one or the second one. But they remember all of them when a competitor calls.
A building materials manufacturer analyzed 18 months of data across 2,400 accounts. They tested dozens of signal combinations. Three signals together predicted churn with 78% accuracy 75 days in advance: order frequency decay, category contraction, payment term extension. Each signal alone performed worse. Combined, they created a powerful early warning system. That is why implementing B2B AI customer prediction is so critical for mid-market distributors who want to stop churn.
The difference between 78% and 52% isn’t academic. At 78% accuracy, you save nearly 6 out of 10 at-risk accounts. At 52%, you’re barely better than guessing.
B2B AI Customer Prediction and Churn Risk Scoring
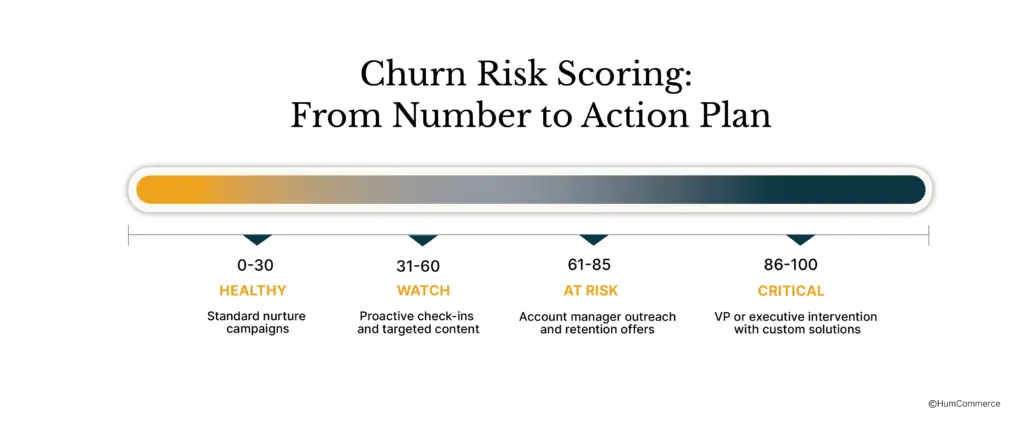
A churn model outputs a 0-100 risk score per account. Systems refresh these scores weekly or daily. You need to translate that score into action:
- 0-30 (Healthy): Standard nurture campaigns
- 31-60 (Watch): Proactive check-ins and targeted content
- 61-85 (At Risk): Account manager outreach and retention offers
- 86-100 (Critical): VP or executive intervention with custom solutions
B2B AI customer prediction models surface the why behind each score. They identify which features drive the risk: order frequency dropping 40%, category contraction, support escalation patterns.
An electrical distributor implemented a 4-tier churn scoring system. At Risk accounts (61-85) received dedicated CSM outreach within 7 days plus a targeted pricing review. Results? 67% of flagged accounts re-engaged within 45 days. Before the model, only 23% of quiet accounts ever came back.
That’s a 3x improvement in retention outcomes. Same sales team. Same products. Different timing.
Propensity-to-Buy Signals: When to Pitch the Upsell
Churn prediction plays defense. Propensity models play offense. They predict which accounts will buy more in the next 30-60 days. More importantly, they predict what those accounts will buy.
These models look at multiple signals simultaneously. Order frequency upticks are obvious. An account ordering every 45 days who suddenly orders at day 38, then day 32, is accelerating. New product category browsing on your portal or website shows interest before purchase intent. Quote requests signal active shopping. Competitor price checks (if you track them through sales conversations or win/loss analysis) reveal who’s in buying mode. Project phases matter for construction and manufacturing customers. Hiring signals work if you integrate external data.
Each account gets a propensity score. The scale runs 0-100. Accounts scoring 70 or above get prioritized. They get better outreach. They get tailored product bundles built specifically for their buying patterns. They get early access to new SKUs before you announce them widely.
An industrial supply company trained a propensity model on 24 months of transaction and engagement data. They identified 340 accounts. That represented 12% of their total customer base. All of them scored 70+ for category expansion specifically. Sales targeted these accounts with custom bundles designed around the categories the model predicted they’d buy.
Results? 41% expanded into a new category within 90 days. Untargeted accounts had just 8% baseline conversion. This generated $840K in incremental revenue in one quarter.
The math matters here. Target 340 accounts, close 139 deals at average expansion value of $6,050. Target everyone, close 8% at massive wasted effort.
Predicting Customer Lifetime Value: Which Accounts Deserve White-Glove Treatment?
B2B AI customer prediction models for LTV prediction models estimate 12-24 month revenue per account. They look at where each account is headed, not where it’s been. The models analyze current trajectory, seasonal patterns, and how similar cohorts behave. Accuracy runs ±10-15% on a 12-month forecast.
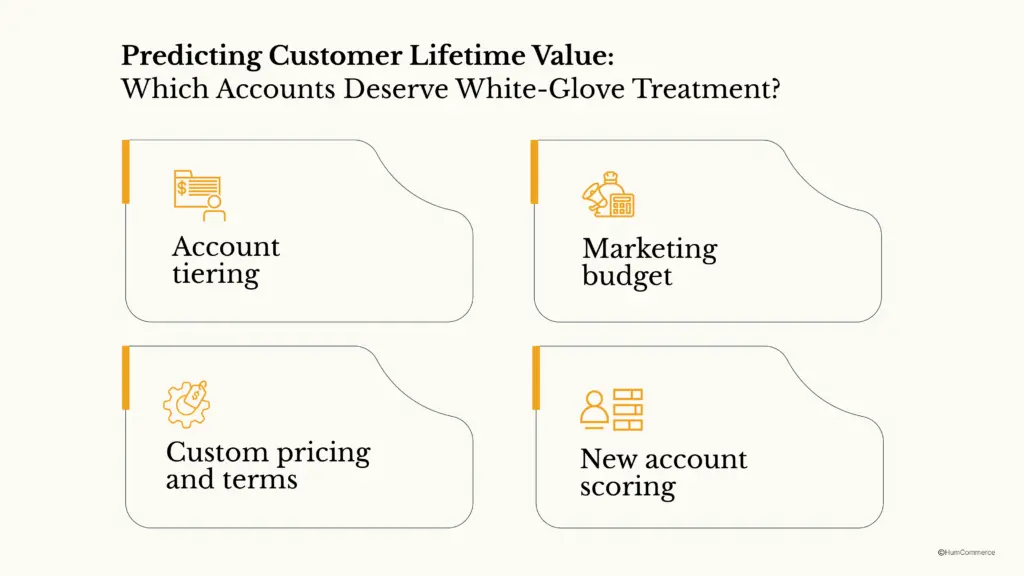
You can use these predictions four ways:
Account tiering gets better when you base it on predicted value instead of historical spend. You assign CSMs to the top 20% predicted LTV accounts, not just your top historical spenders.
Marketing budget allocation improves when you model CAC payback based on predicted lifetime value. You know which acquisition channels and customer profiles actually pay back.
Custom pricing and terms make more sense when you know predicted LTV. You can offer better terms to accounts the model predicts will become high-value, even if they’re small today.
New account scoring helps you prioritize onboarding resources. You predict LTV at the 90-day mark and focus your limited onboarding capacity on accounts most likely to grow.
A plumbing supply distributor used LTV prediction to completely re-tier their 1,800 accounts. The top 15% had predicted LTV of $250K or higher. Those accounts got dedicated account managers regardless of their historical spend. The middle 50% got segmented digital nurture campaigns. The bottom 35% moved to a self-serve model.
Results: Top-tier LTV grew 22% year-over-year. The overall CLTV:CAC ratio improved from 4.2:1 to 6.8:1.
That ratio change means you’re pulling 62% more lifetime value from each dollar you spend acquiring customers. The unit economics just fundamentally improved.
The Intervention Playbook: What to Do When AI Flags Churn or Opportunity
Predictions need to trigger actions. Some automated. Some human. Both matter.
When churn risk spikes, you need interventions ready:
Start email nurture sequences with educational content and case studies that address common objection patterns. Get your account manager on the phone or send a personal email, not a template. Review pricing or offer loyalty discounts if the model flags price sensitivity. Schedule executive business reviews for high-value accounts where C-level involvement matters. Launch service recovery when support issues are detected as drivers of the churn risk.
When propensity scores signal upsell opportunity:
Send product recommendation emails timed to the buying window. Alert your sales reps with suggested talk tracks specific to what the model predicts they’ll buy. Create limited-time bundle offers that combine their current purchases with predicted next categories. Give early access to new products before you launch them publicly.
Timing matters. Intervene 60-75 days before predicted churn. Approach for upsells 14-30 days before the predicted purchase window.
An automotive parts distributor built prediction-to-action automation. Churn scores of 70+ triggered a 3-touch email sequence plus an account manager alert. No response within 14 days? The system initiated a pricing review and phone call. Customer responded? They received a custom retention offer.
This approach saved 58% of flagged accounts. Ad-hoc outreach before automation saved just 19%.
The automation didn’t replace human judgment. It scaled it. Sales reps focused their limited time on the accounts most likely to respond.
Prediction-Driven Segmentation: Beyond Firmographics to Behavioral Cohorts
Traditional B2B segmentation sorts by industry, company size, geography. Those attributes don’t predict behavior. Prediction-driven segmentation builds behavioral cohorts. You group accounts by predicted trajectory, not static attributes.
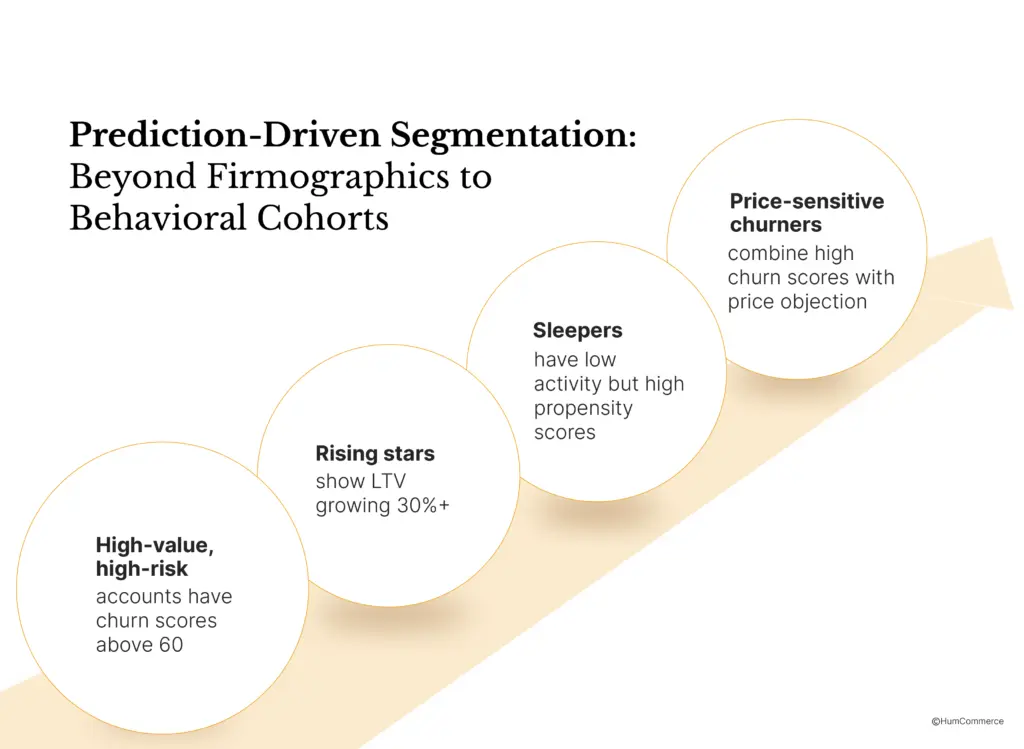
Here are cohorts that actually predict future behavior:
High-value, high-risk accounts have churn scores above 60 and LTV in your top 20%. These need immediate executive attention.
Rising stars show LTV growing 30%+ year-over-year with low churn risk. These accounts deserve more investment than their current size suggests.
Sleepers have low activity but high propensity scores. They’re not buying much now, but the model predicts they’re about to expand.
Price-sensitive churners combine high churn scores with price objection signals from sales notes and support tickets. These accounts need pricing intervention or they’ll leave.
Each cohort needs different treatment. Different messaging. Different offers. Different account management approaches. The segments refresh monthly or quarterly as predictions update and accounts move between cohorts.
A chemical distributor replaced 5 industry-based segments with 8 behavioral cohorts. Their High-value, high-risk segment (180 accounts) received executive-level engagement and custom contracts. Retention: 82% versus 41% under the old approach.
Their Rising stars segment (290 accounts) received upsell-focused campaigns. 34% expanded their spend. Revenue concentration in the top 2 cohorts grew from 38% to 61%.
You can segment by what customers are likely to do next quarter. Or you can segment by what industry they’re in. One predicts the future. One describes the past.
How Predictions Flow from Your Data Warehouse into Salesforce, HubSpot, or Marketo
B2B AI customer prediction models run on data warehouses like Snowflake or BigQuery. Some use ML platforms like Databricks or AWS SageMaker. The outputs come in three forms: churn scores, next purchase dates, LTV forecasts. They flow into your CRM as custom fields. Some companies refresh these daily. Others do it weekly depending on how fast their business moves. Integration happens via APIs or reverse ETL tools. Census and Hightouch are common choices for this.
Once predictions land in your CRM, they become actionable. Sales reps see scores on account pages when they pull up a customer record. Marketing automation workflows kick in automatically. Email sequences trigger. Ads get served. Reporting dashboards pull the data for executive review.
For Adobe Commerce customers, HumCommerce integrates predictions at the checkout and account portal layer. This enables personalized experiences based on what the model predicts each customer will do next.
An industrial machinery manufacturer integrated churn and LTV predictions from Snowflake into Salesforce. They used Hightouch for the integration. Scores refresh every night at 2 AM. Sales reps see them first thing when they log in. High-risk accounts get auto-flagged in a daily digest that hits inboxes at 8 AM. Marketing automation triggers retention email series when churn scores cross 65.
Results came faster than expected: 71% of reps were actively using the scores within 60 days. Churn dropped 24% over 9 months.
The technical implementation took 6 weeks. The business impact has compounded for years since then.
B2B AI Customer Prediction Accuracy Benchmarks
What accuracy should you expect? Here are realistic targets:
Churn prediction typically delivers 70-85% accuracy. There’s a precision/recall trade-off here. Higher recall means you catch more churners but also flag more false alarms. You need to decide which mistake costs more.
Next purchase timing hits ±7-14 days for 60-70% of accounts. Some customer types are easier to predict than others.
LTV forecasts run with ±10-15% error for a 12-month horizon. That’s tight enough to make real resource allocation decisions.
Models improve as they ingest more data and actual outcomes. Here’s the typical trajectory. Baseline models hit 65-70% churn accuracy in the first three months. Not amazing, but actionable. Tuned models reach 75-80% accuracy by months 6-12 after you’ve refined features and fixed false positives. Mature segment-specific models achieve 80-85% accuracy after 12+ months when you’ve built separate models for different customer types.
A wholesaler launched an initial churn model at 68% accuracy. Nothing spectacular. After 6 months of tuning (reviewing false positives, refining features, adjusting thresholds), accuracy reached 79%. By month 14, they had built segment-specific models organized by industry vertical. Those hit 83-86% accuracy.
Business impact scaled directly with accuracy improvements. At 68% accuracy, retention improved 40%. At 79%, retention jumped to 58%. At 83%, they hit 67% retention improvement.
Even at 68% accuracy, the model paid for itself in the first quarter. Every accuracy point gained after that was pure margin expansion.
The Customer Prediction Readiness Model: Do You Have Enough Data to Start?
What's the minimum viable data for B2B AI customer prediction?
You need 18-24 months of transaction history. That means order date, order value, line items. You need 500+ active customer accounts. More is better. 1,000+ is ideal. You need a CRM or ERP system that logs customer interactions. And you need at least monthly order frequency for most of your customers. Annual purchase cycles make prediction much harder.
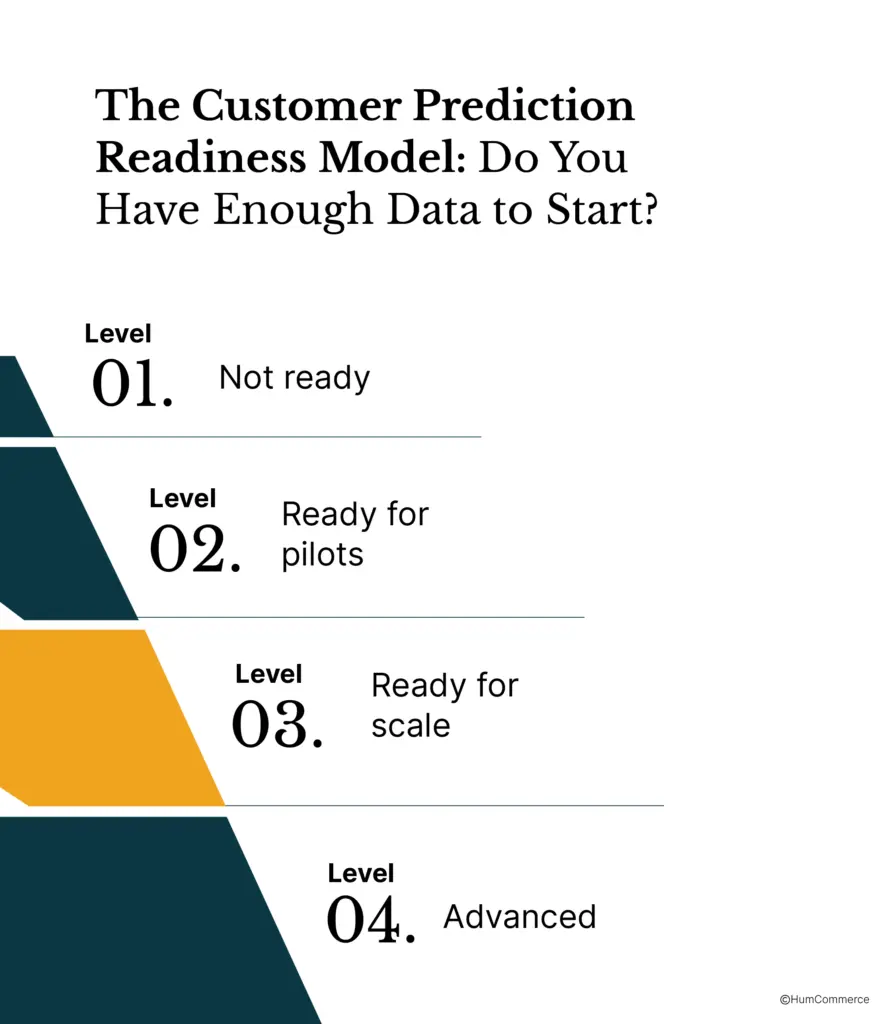
Companies typically fall into one of four readiness levels.
Level 1 (Not ready): Less than 12 months of data, fewer than 300 accounts, no CRM. You’re not ready yet. Fix your data infrastructure first.
Level 2 (Ready for pilots): 18+ months of data, 500-1K accounts, basic CRM. You can start with a pilot on your top accounts.
Level 3 (Ready for scale): 24+ months of data, 1K+ accounts, integrated CRM/ERP/eCommerce. You’re ready to deploy across your full customer base.
Level 4 (Advanced): 36+ months of data, 2K+ accounts, enriched with support tickets, engagement metrics, external signals. You can build sophisticated multi-model systems.
A distributor assessed themselves at Level 2. They had 19 months of clean data, 740 accounts, and Salesforce CRM. Not perfect, but sufficient. They started with a churn model pilot focused on their top 200 accounts. Lower risk that way. After 4 months of good results, they expanded to their full customer base. By month 10 they had added LTV and propensity models. Their progression from Level 2 to Level 3 took 8 months. Most of that time was spent accumulating more transaction data and finishing their integration work.
Most B2B companies land at Level 2 or 3 when they first assess readiness. Level 2 is enough to start with a pilot. You don’t need perfect data. You need sufficient data.
Customer Prediction Readiness Checklist: Score Your Data and Prioritize Use Cases
A comprehensive readiness checklist helps you figure out where you stand today and which use cases to prioritize.
What’s in the checklist?
Data inventory assesses transaction history depth, customer count, and feature availability. Do you have the raw materials to build models?
System readiness evaluates CRM/ERP/eCommerce integration, data warehouse infrastructure, and API access. Can your systems talk to each other?
Use case prioritization matrix helps you decide which to tackle first. Churn? LTV? Propensity? The answer depends on your specific business pain points and data strengths.
Team readiness checks whether you have sales and CX buy-in. Do you have marketing automation in place to act on predictions?
ROI calculator estimates revenue impact from churn reduction, upsell lift, and LTV improvement based on your specific numbers.
The output gives you a readiness score and a recommended 6-12 month roadmap.
A construction supplier scored as Level 2 (Ready for pilot). Their checklist revealed strong transaction data but weak support and engagement data. They prioritized a churn model first. Why? It offered the highest ROI with the data they already had. They deferred the propensity model for 6 months. That gave them time to enrich their data with support tickets and portal engagement metrics.
The checklist took 2 hours to complete. It saved them 6 months of building the wrong thing first.
Why HumCommerce Builds Customer Intelligence for B2B
HumCommerce works with B2B manufacturers, distributors, wholesalers running Adobe Commerce who struggle to unify customer data across ERP, CRM, eCommerce systems. We build data pipelines that feed prediction models. We integrate prediction outputs back into CRM and marketing automation. We translate machine learning outputs into workflows that sales and customer experience teams can use.
We partner with your data team or bring in machine learning partners to build models, then handle the last mile. We get predictions into Salesforce, HubSpot, or Adobe Commerce account portals where they drive action. HumCommerce has worked with industrial supply companies, general distributors, manufacturing clients to integrate Adobe Commerce transaction data with Salesforce. We build customer intelligence dashboards that surface churn, LTV, propensity scores directly to account managers.
Ready to turn your B2B customer data into predictive intelligence? Download the Customer Prediction Readiness Checklist. It will help you score your data maturity and identify which use case to prioritize first. Or book a consultation with HumCommerce. We’ll review your readiness assessment together and map out a customer intelligence roadmap tailored to your specific business situation.